PUBLISHED ON October 15, 2026
Dalsia Energy Report 2025/2026: How Data Helps Us Understand and Manage Heating Consumption
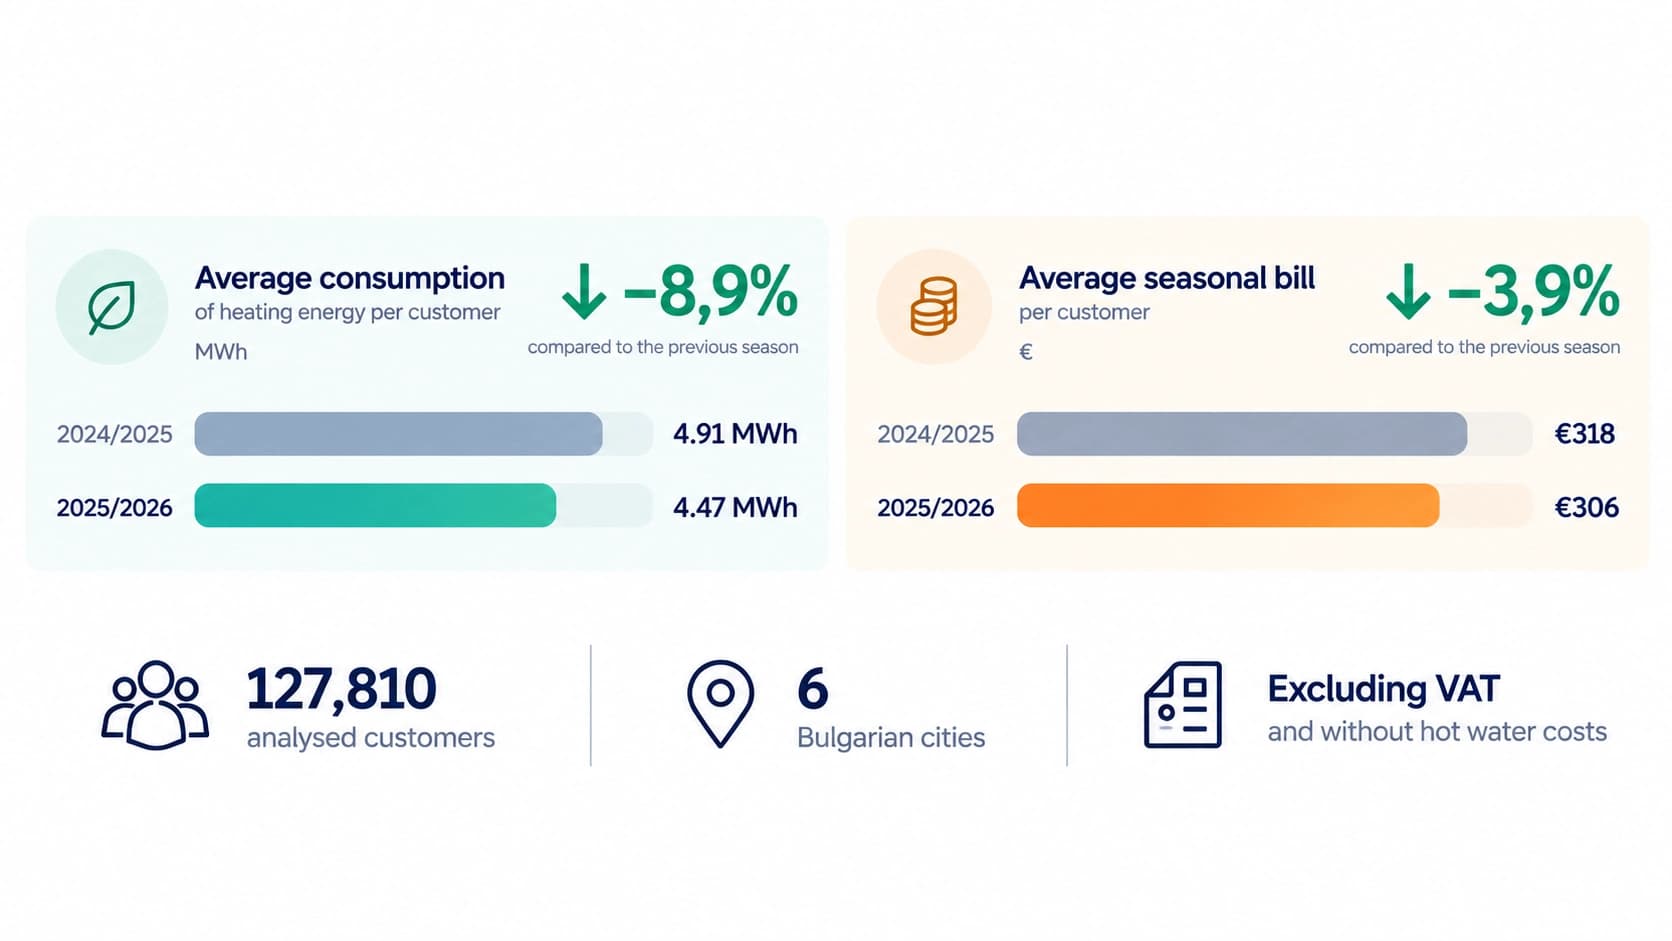
Dalsia analysed the annual heating cost settlement statements of 127,810 customers for the 2025/2026 heating season across six Bulgarian cities: Sofia, Plovdiv, Razgrad, Pleven, Kozloduy and Ruse.
The data provides a clearer picture not only of heating costs throughout the season, but also of the relationship between energy consumption, heat prices, heated building volume and building characteristics.
Across the analysed customer base, average heating energy consumption decreased by 8.9% to 4.47 MWh per customer, while the weighted average seasonal heating bill fell by 3.9% to €306 compared with the 2024/2025 season.
The city-level results reveal different trends and demonstrate how actual energy consumption and heat prices combine to determine the final heating bill.
These differences reflect a combination of the amount of energy used, heated building volume, building characteristics and the price of heating energy.
By comparing these factors, heating bills become more than financial statements — they become a valuable source of information about how we use energy.
Sofia: Lower Consumption and Lower Average Heating Bills
Sofia accounts for the largest share of the analysis, with more than 100,000 customers.
Average heating consumption per customer decreased from 4.96 MWh in 2024/2025 to 4.45 MWh in 2025/2026, representing a reduction of 10.4%.
At the same time, the average price of heating energy increased from €65.6/MWh to €69.5/MWh.
Despite this price increase, the average seasonal heating bill decreased from €325.5 to €308.9, a reduction of 5.1%.
The change is also reflected in energy consumption relative to heated building volume, which declined from 27.3 kWh/m³ to 24.5 kWh/m³ — approximately 10% lower.
Plovdiv: A Stable Season with Lower Consumption
Changes in Plovdiv were relatively modest compared with the previous heating season.
Average consumption decreased from 3.87 MWh to 3.69 MWh per customer, while the average seasonal heating bill remained virtually unchanged, moving from €251.7 to €252.3.
Energy consumption relative to heated building volume also declined, from 23.5 kWh/m³ to 22.4 kWh/m³.
Razgrad: Higher Consumption and Higher Average Heating Bills
Razgrad shows a different trend, illustrating the impact of increased heating consumption.
Higher energy consumption, combined with an increase in the average heating energy price from €68.4/MWh to €70.6/MWh, resulted in an average seasonal bill of €368, compared with €319 a year earlier.
This represents an increase of 15.4%.
Kozloduy: The Highest Consumption per Unit of Heated Volume
Kozloduy continues to stand out for its relatively low heating energy price and high consumption levels.
During the 2025/2026 season, the average price was €38.5/MWh — the lowest among the cities analysed.
At the same time, average consumption reached 8.14 MWh per customer, the highest level in the analysis.
Energy consumption relative to heated building volume increased from 48.4 kWh/m³ in the previous season to 51.5 kWh/m³.
Kozloduy therefore illustrates how a lower energy price can coexist with significantly higher consumption intensity.
Ruse: Higher Consumption Despite Lower Energy Prices
The results for Ruse reveal another important pattern.
Average heating consumption increased from 4.85 MWh to 5.46 MWh per customer, an increase of 12.4%.
Meanwhile, the average heating energy price decreased from €54.4/MWh to €49.9/MWh.
However, the lower energy price did not fully offset the increase in consumption. As a result, the average seasonal heating bill rose from €267.2 to €272.2, or 1.9%.
Pleven: How Energy Prices and Consumption Affect Heating Bills
In Pleven, the average seasonal heating bill increased from €202.7 in 2024/2025 to €249.1 in 2025/2026, representing an increase of 22.9%.
Average heating consumption also increased, from 4.40 MWh to 5.20 MWh per customer.
Consumption relative to heated building volume rose from 26.9 kWh/m³ to 31.5 kWh/m³.
At the same time, the average heating energy price increased from €46.0/MWh to €47.9/MWh.
Heating Consumption per Unit of Heated Volume Varies by More Than Twofold
To provide a more meaningful comparison, the Dalsia Energy Report also examines heating energy consumption relative to heated building volume.
The lowest average value was recorded in Plovdiv at 22.4 kWh/m³, followed by Sofia at 24.5 kWh/m³ and Ruse at 28.3 kWh/m³.
Pleven recorded 31.5 kWh/m³, Razgrad 34.3 kWh/m³, and Kozloduy 51.5 kWh/m³.
The difference between the lowest and highest values is approximately 2.3 times.
Heating consumption is influenced by several factors, including building characteristics, thermal insulation, heating systems, weather conditions and occupant behaviour.
This is why comparing heating costs requires looking beyond energy prices and considering the amount of energy needed to heat a building.
What Are the Key Trends for the 2025/2026 Heating Season?
Dalsia's data highlights several important trends.
The overall results are largely driven by Sofia, which accounts for the majority of customers included in the analysis. In Sofia, heating consumption decreased by 10.4%, while the average seasonal bill fell by 5.1%, despite an increase in the average energy price.
A lower price per MWh does not necessarily mean a lower heating bill. Kozloduy has the lowest heating energy price in the analysis, at €38.5/MWh, but also the highest consumption per unit of heated building volume, at 51.5 kWh/m³.
An increase in consumption can outweigh a reduction in energy prices. In Ruse, a 9.4% decrease in the energy price was more than offset by a 12.4% increase in consumption, resulting in a 1.9% rise in the average heating bill.
From Annual Heating Bills to Greater Control Over Consumption
An annual heating cost settlement statement shows what has already happened.
For households, however, information is even more valuable when it enables them to respond while the heating season is still underway.
Monthly remote meter reading and monthly billing make it possible to monitor consumption regularly, rather than discovering the final outcome only after the heating season has ended.
This transforms heating data from an annual statistic into a practical tool for managing energy consumption and household budgets.
What Can Influence Heating Bills?
Heating costs depend on more than the price of heating energy.
Actual consumption, building characteristics, heating installations, thermal insulation, building orientation, weather conditions and the way households manage their heating all play a role.
This explains why the data from different cities shows that a lower price per MWh does not always translate into a lower final bill.
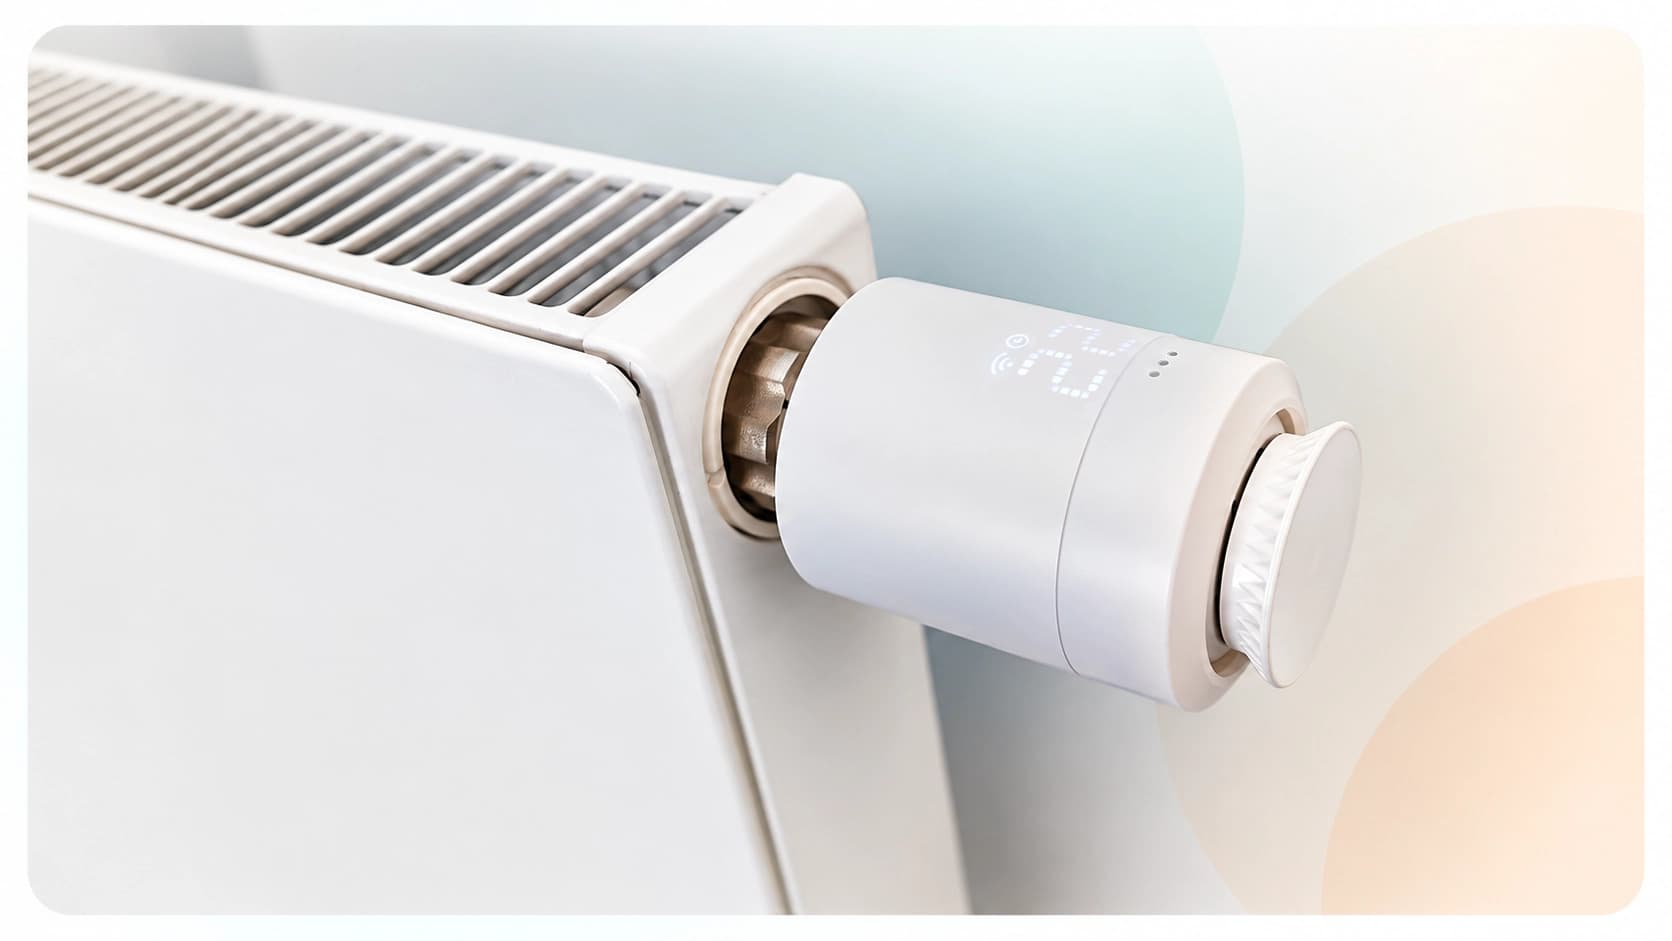
One of the most direct ways for households to gain greater control over heating consumption is to combine remote radiator control with monthly remote meter reading.
What Do the Trends for the 2025/2026 Season Tell Us?
Dalsia's analysis identifies several useful trends that help explain how heating costs are determined.
Across the entire analysed customer base, average consumption decreased by 8.9%, while the weighted average seasonal heating bill fell by 3.9%.
Sofia, representing 88.5% of customers in the analysis, recorded both lower consumption and lower average heating bills.
Comparisons between cities also demonstrate that the price per MWh is only one factor influencing heating costs.
For example, Kozloduy recorded the lowest energy price in the analysis, at €38.5/MWh, while also having the highest consumption per unit of heated building volume, at 51.5 kWh/m³.
Another important step towards better consumption management is monthly remote meter reading.
From Annual Data to Better Consumption Management
An annual heating cost settlement statement summarises the results of the previous heating season.
For households, regular consumption information is even more useful because it allows them to monitor and manage heating use throughout the season.
Monthly information also makes household budgeting easier, transforming consumption from something measured retrospectively into a figure that can be tracked continuously.
In this way, heating data becomes more than an annual statistic. It becomes a practical tool for making better-informed decisions about energy consumption and household expenditure.
How Can We Manage Heating Consumption More Effectively?
Heating costs are determined by a combination of factors: actual energy consumption, building and heating system characteristics, thermal insulation, building orientation, weather conditions and how households use their heating.
This means that, alongside energy prices, there are factors that consumers can influence to some extent.
Combining remote radiator control with monthly remote meter reading provides more information and enables better control over heating consumption.
About the Analysis
The Dalsia Energy Report is based on the annual heating cost settlement statements for the 2025/2026 heating season of 127,810 customers in Sofia, Plovdiv, Razgrad, Pleven, Kozloduy and Ruse, Bulgaria.
The average values reported for each city represent averages per customer and are calculated based on customers who used heating during the respective period.
The analysis excludes domestic hot water costs. All amounts are stated excluding VAT.
Data for the 2025/2026 heating season is compared with the corresponding figures for the 2024/2025 season.